Guides
Frequency in Segmentation
A standard Segmentation query shows the total number of times an event occurred over time, or the total amount of users who engaged in an event. With frequency queries, you can group users into different segments based on the number of times that they engaged in a particular event, allowing for analysis of groups that take part in an event multiple times.
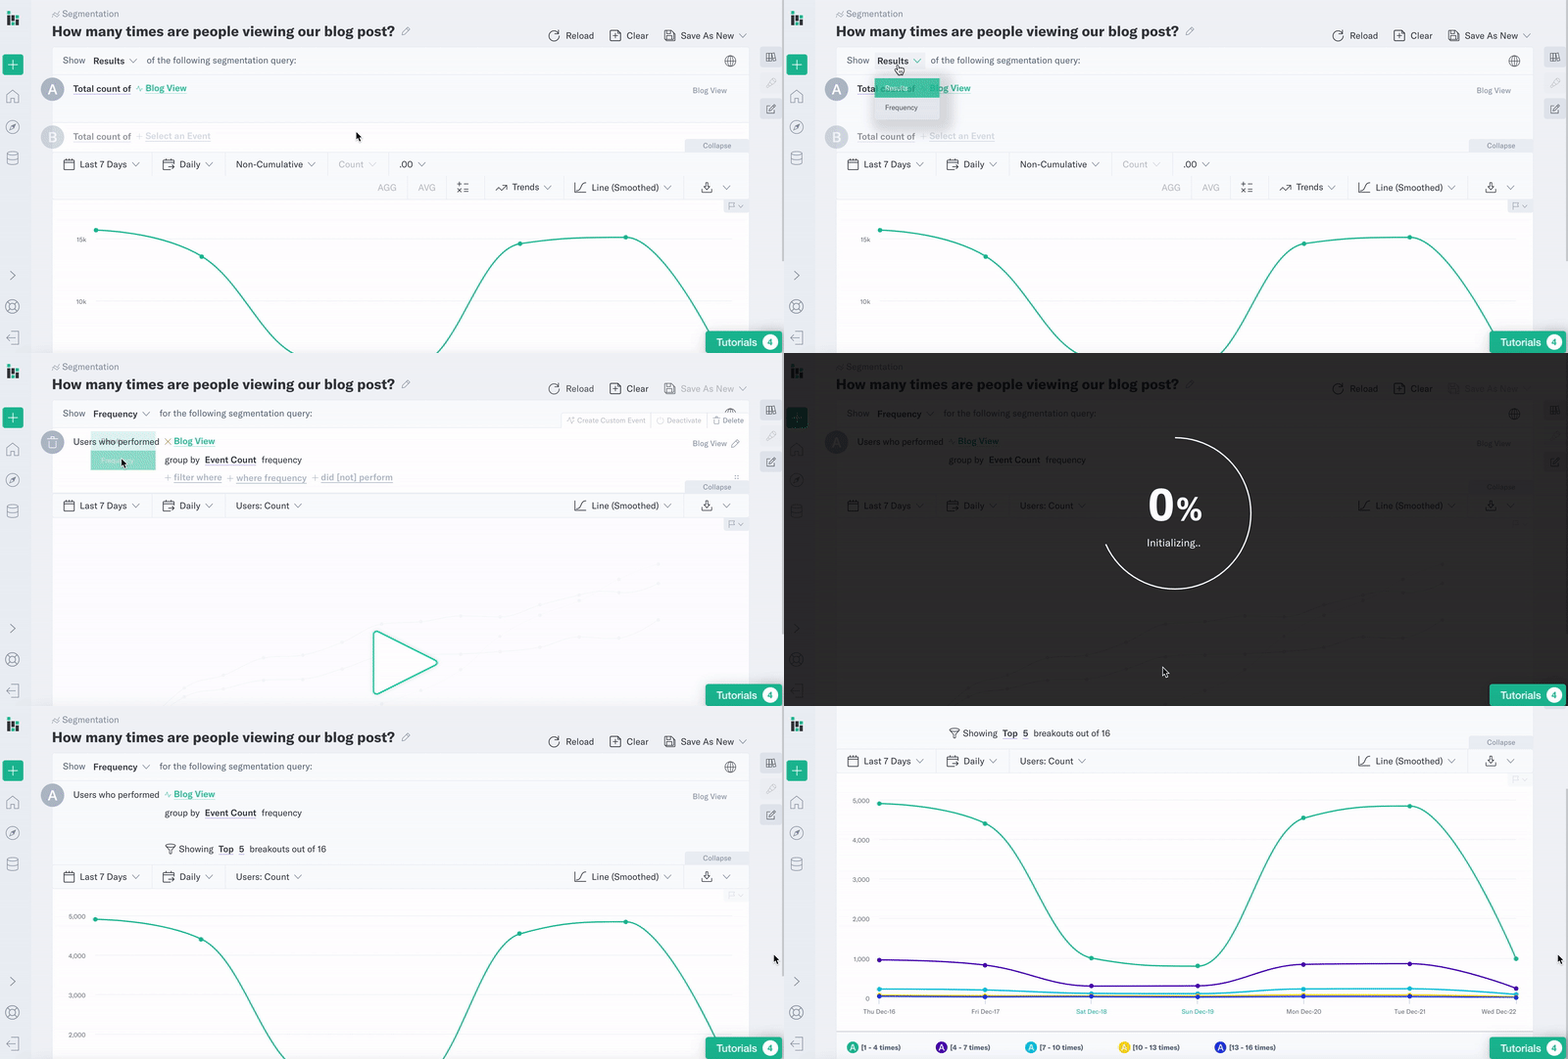
To get started, look just under the title of the query and change “Show Results of the following segmentation query” to “Show frequency for the following segmentation query.” The query builder will allow groups based on event count or a time interval like hours, weeks, or months. Then run your query.

The different colored lines in the resulting visualization correspond to the individual breakouts in the query. To see what each line represents, refer to the key at the bottom left. The amount of breakouts can be adjusted in the query builder from five to 50, depending on the data set, as well as customized to show the top, bottom, or all frequency segments.
With this type of query, users can gain insight into users that either engage with their product more often or those who engage less often. These insights might allow for targeted campaigns that aim to increase engagement among less-frequent users, or to offer special rewards or recommendations for power users. To drill down into different sets of users, select a data point on the chart and create a user segment in the drop-down menu.
Was this page helpful?