Documentation
Developers
API References
Data Subject Request API
Data Subject Request API Version 1 and 2
Data Subject Request API Version 3
Platform API
Platform API Overview
Accounts
Apps
Audiences
Calculated Attributes
Data Points
Feeds
Field Transformations
Services
Users
Workspaces
Warehouse Sync API
Warehouse Sync API Overview
Warehouse Sync API Tutorial
Warehouse Sync API Reference
Data Mapping
Warehouse Sync SQL Reference
Warehouse Sync Troubleshooting Guide
ComposeID
Warehouse Sync API v2 Migration
Bulk Profile Deletion API Reference
Custom Access Roles API
Calculated Attributes Seeding API
Data Planning API
Group Identity API Reference
Pixel Service
Profile API
Events API
mParticle JSON Schema Reference
IDSync
Client SDKs
AMP
AMP SDK
Android
Initialization
Configuration
Network Security Configuration
Event Tracking
User Attributes
IDSync
Screen Events
Commerce Events
Location Tracking
Media
Kits
Application State and Session Management
Data Privacy Controls
Error Tracking
Opt Out
Push Notifications
WebView Integration
Logger
Preventing Blocked HTTP Traffic with CNAME
Linting Data Plans
Troubleshooting the Android SDK
API Reference
Upgrade to Version 5
Cordova
Cordova Plugin
Identity
Direct Url Routing
Direct URL Routing FAQ
Web
Android
iOS
iOS
Initialization
Configuration
Event Tracking
User Attributes
IDSync
Screen Tracking
Commerce Events
Location Tracking
Media
Kits
Application State and Session Management
Data Privacy Controls
Error Tracking
Opt Out
Push Notifications
Webview Integration
Upload Frequency
App Extensions
Preventing Blocked HTTP Traffic with CNAME
Linting Data Plans
Troubleshooting iOS SDK
Social Networks
iOS 14 Guide
iOS 15 FAQ
iOS 16 FAQ
iOS 17 FAQ
iOS 18 FAQ
API Reference
Upgrade to Version 7
React Native
Getting Started
Identity
Unity
Upload Frequency
Getting Started
Opt Out
Initialize the SDK
Event Tracking
Commerce Tracking
Error Tracking
Screen Tracking
Identity
Location Tracking
Session Management
Web
Initialization
Configuration
Content Security Policy
Event Tracking
User Attributes
IDSync
Page View Tracking
Commerce Events
Location Tracking
Media
Kits
Application State and Session Management
Data Privacy Controls
Error Tracking
Opt Out
Custom Logger
Persistence
Native Web Views
Self-Hosting
Multiple Instances
Web SDK via Google Tag Manager
Preventing Blocked HTTP Traffic with CNAME
Facebook Instant Articles
Troubleshooting the Web SDK
Browser Compatibility
Linting Data Plans
API Reference
Upgrade to Version 2 of the SDK
Xamarin
Getting Started
Identity
Web
Alexa
Server SDKs
Node SDK
Go SDK
Python SDK
Ruby SDK
Java SDK
Quickstart
Android
Overview
Step 1. Create an input
Step 2. Verify your input
Step 3. Set up your output
Step 4. Create a connection
Step 5. Verify your connection
Step 6. Track events
Step 7. Track user data
Step 8. Create a data plan
Step 9. Test your local app
Python Quick Start
Step 1. Create an input
Step 2. Create an output
Step 3. Verify output
Guides
Partners
Introduction
Outbound Integrations
Outbound Integrations
Firehose Java SDK
Inbound Integrations
Compose ID
Data Hosting Locations
Glossary
Migrate from Segment to mParticle
Migrate from Segment to mParticle
Migrate from Segment to Client-side mParticle
Migrate from Segment to Server-side mParticle
Segment-to-mParticle Migration Reference
Rules Developer Guide
API Credential Management
The Developer's Guided Journey to mParticle
Guides
Customer 360
Overview
Group Identity
Overview
Create and Manage Group Definitions
Getting Started
Create an Input
Start capturing data
Connect an Event Output
Create an Audience
Connect an Audience Output
Transform and Enhance Your Data
Personalization
Introduction
Profiles
Audiences
Audiences Overview
Create an Audience
Connect an Audience
Manage Audiences
Real-time Audiences (Legacy)
Standard Audiences (Legacy)
Calculated Attributes
Calculated Attributes Overview
Using Calculated Attributes
Create with AI Assistance
Calculated Attributes Reference
Predictive Audiences
Predictive Audiences Overview
Using Predictive Audiences
Journeys
Journeys Overview
Manage Journeys
Download an audience from a journey
Audience A/B testing from a journey
Journeys 2.0
Predictive Attributes
What are predictive attributes?
Platform Guide
Billing
Usage and Billing Report
The New mParticle Experience
The new mParticle Experience
The Overview Map
Observability
Observability Overview
Observability User Guide
Observability Troubleshooting Examples
Observability Span Glossary
Event Forwarding
System Alerts
Trends
User Profiles
Introduction
Data Retention
Data Catalog
Connections
Activity
Data Plans
Live Stream
Data Filter
Rules
Blocked Data Backfill Guide
Tiered Events
mParticle Users and Roles
Analytics Free Trial
Troubleshooting mParticle
Usage metering for value-based pricing (VBP)
IDSync
IDSync Overview
Use Cases for IDSync
Components of IDSync
Store and Organize User Data
Identify Users
Default IDSync Configuration
Profile Conversion Strategy
Profile Link Strategy
Profile Isolation Strategy
Best Match Strategy
Aliasing
Analytics
Introduction
Core Analytics
Setup
Sync and Activate Analytics User Segments in mParticle
User Segment Activation
Welcome Page Announcements
Settings
Project Settings
Roles and Teammates
Organization Settings
Global Project Filters
Portfolio Analytics
Analytics Data Manager
Analytics Data Manager Overview
Events
Event Properties
User Properties
Revenue Mapping
Export Data
UTM Guide
Analyses
Analyses Introduction
Segmentation: Basics
Getting Started
Visualization Options
For Clauses
Date Range and Time Settings
Calculator
Numerical Settings
Segmentation: Advanced
Assisted Analysis
Properties Explorer
Frequency in Segmentation
Trends in Segmentation
Did [not] Perform Clauses
Cumulative vs. Non-Cumulative Analysis in Segmentation
Total Count of vs. Users Who Performed
Save Your Segmentation Analysis
Export Results in Segmentation
Explore Users from Segmentation
Funnels: Basics
Getting Started with Funnels
Group By Settings
Conversion Window
Tracking Properties
Date Range and Time Settings
Visualization Options
Interpreting a Funnel Analysis
Funnels: Advanced
Group By
Filters
Conversion over Time
Conversion Order
Trends
Funnel Direction
Multi-path Funnels
Analyze as Cohort from Funnel
Save a Funnel Analysis
Explore Users from a Funnel
Export Results from a Funnel
Saved Analyses
Manage Analyses in Dashboards
Query Builder
Data Dictionary
Query Builder Overview
Modify Filters With And/Or Clauses
Query-time Sampling
Query Notes
Filter Where Clauses
Event vs. User Properties
Group By Clauses
Annotations
Cross-tool Compatibility
Apply All for Filter Where Clauses
Date Range and Time Settings Overview
User Attributes at Event Time
Understanding the Screen View Event
User Aliasing
Dashboards
Dashboards––Getting Started
Manage Dashboards
Dashboard Filters
Organize Dashboards
Scheduled Reports
Favorites
Time and Interval Settings in Dashboards
Query Notes in Dashboards
Analytics Resources
The Demo Environment
Keyboard Shortcuts
User Segments
Warehouse Sync
Data Privacy Controls
Data Subject Requests
Default Service Limits
Feeds
Cross-Account Audience Sharing
Approved Sub-Processors
Import Data with CSV Files
Import Data with CSV Files
CSV File Reference
Glossary
Video Index
Analytics (Deprecated)
Identity Providers
Single Sign-On (SSO)
Setup Examples
Introduction
Developer Docs
Introduction
Integrations
Introduction
Rudderstack
Google Tag Manager
Segment
Data Warehouses and Data Lakes
Advanced Data Warehouse Settings
AWS Kinesis (Snowplow)
AWS Redshift (Define Your Own Schema)
AWS S3 Integration (Define Your Own Schema)
AWS S3 (Snowplow Schema)
BigQuery (Snowplow Schema)
BigQuery Firebase Schema
BigQuery (Define Your Own Schema)
GCP BigQuery Export
Snowflake (Snowplow Schema)
Snowplow Schema Overview
Snowflake (Define Your Own Schema)
Developer Basics
Aliasing
Analytics for Marketers
PetBox is a fictional eCommerce company that sells monthly subscription boxes containing animal care products. In the accompanying PetBox app, subscribers can track and customize their monthly boxes, view their box history, and purchase specific products they liked from their boxes. In addition, non-subscribers have access to features such as PetCam, which allows them to watch their cats through connected webcams.
PetBox wants to cross-sell cat toys to customers who are already purchasing their products but not necessarily in the toys category. They will start with cat food purchasers and create targeted campaigns if these consumers are not already buying cat toys.
Goal/Business Question
Are cat food purchasers also purchasing cat toys?
Create a Segment of Cat Food Purchasers
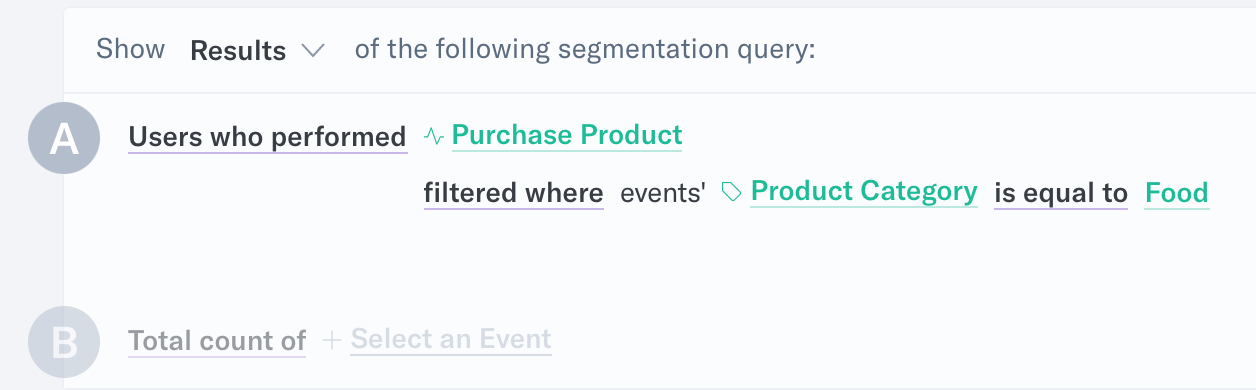
- We first need to create a user segment for cat food purchasers in Segmentation. You can do so by selecting the Purchase Product event and for Filter Where, select Product Category. In the text box to the right of is equal to, you should type ”Food“.
-
If the start of the query row reads Total count of instead of Users who performed, you should make that change as well. Your final results should look like this:
-
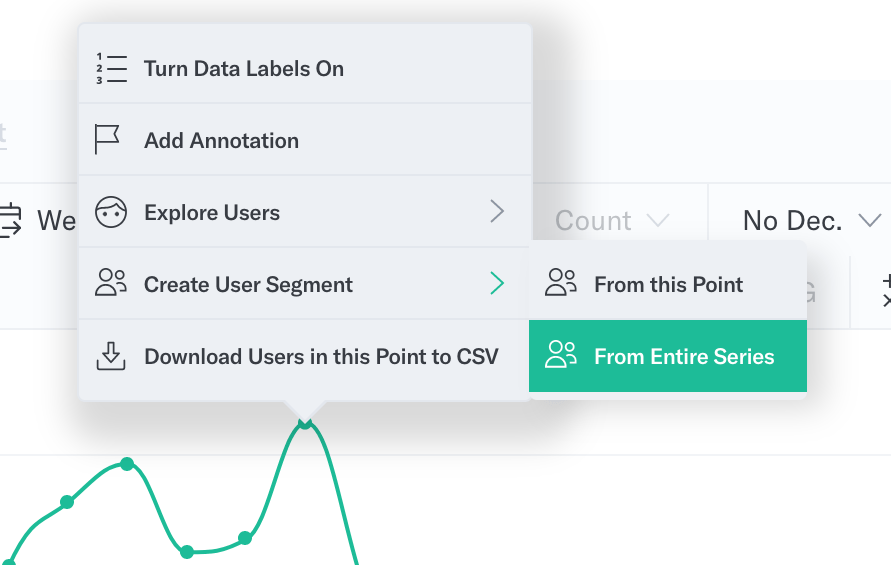
Use 04/01/xxxx to Today in your date range selector and run the query. Click on any point and hover over Create User Segment. Be sure to then click on From entire series to get the users from the full date range.
-
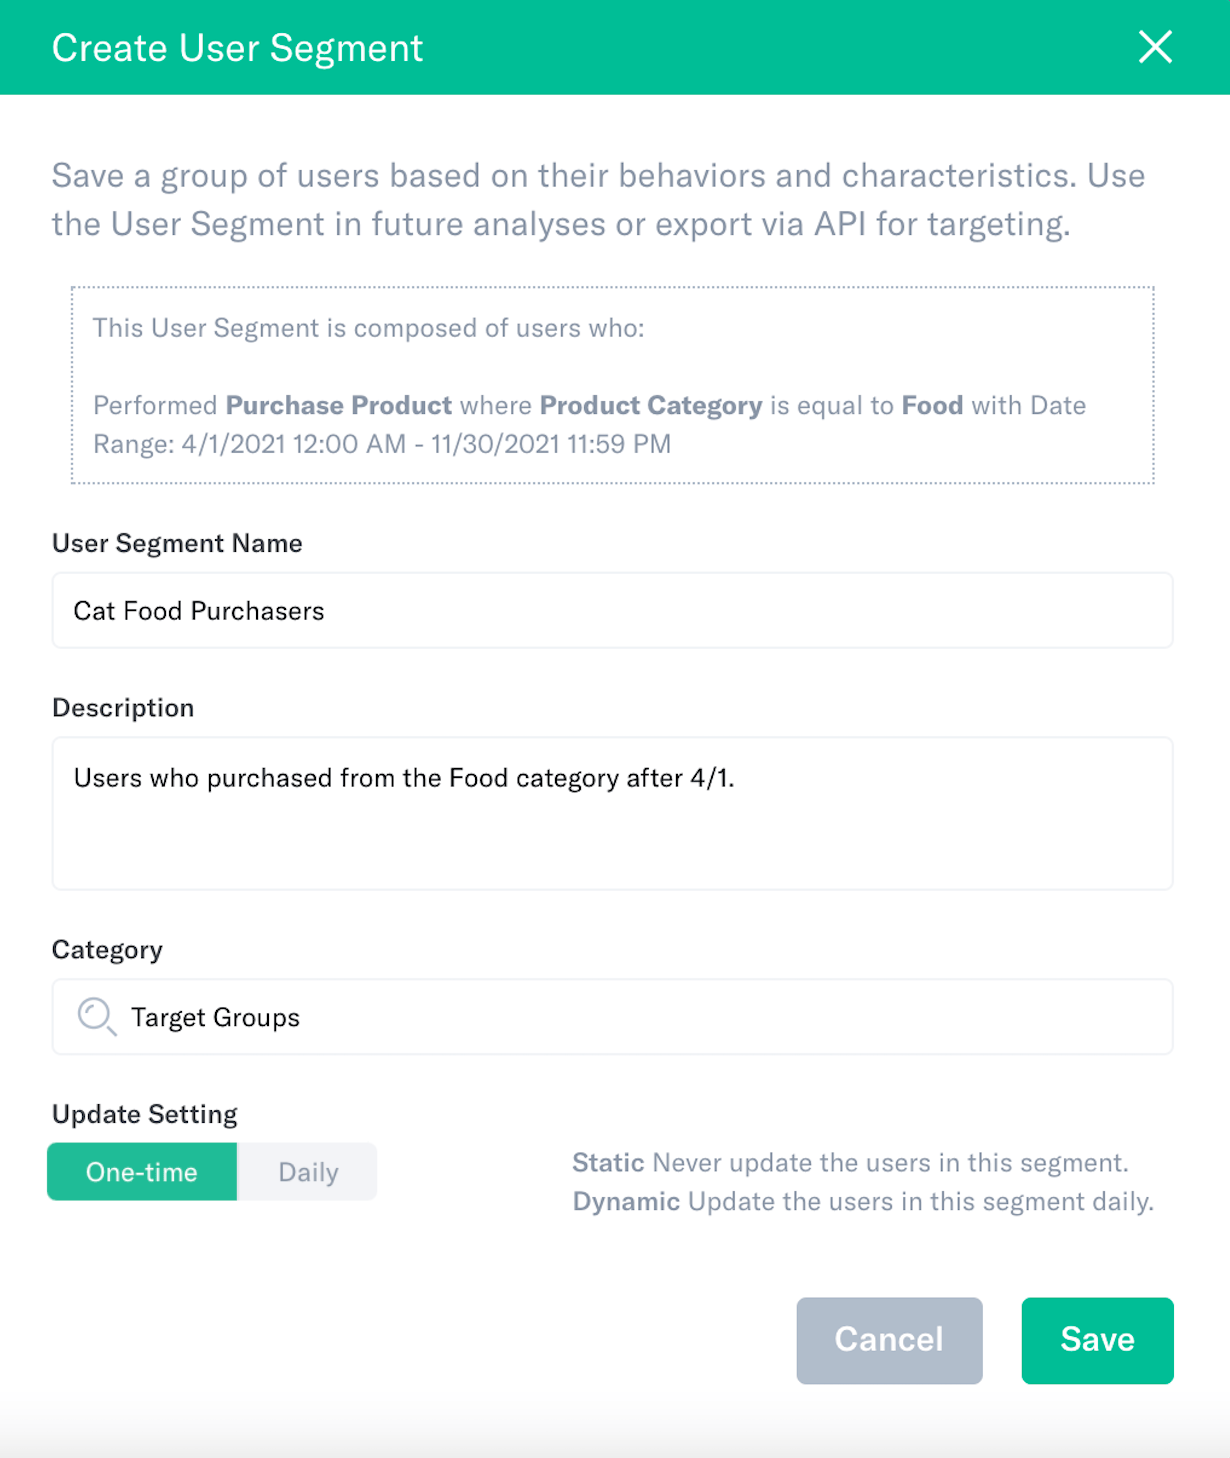
Below is the Create a User Segment modal. Name the segment and provide a description so we can remember what we saved in the future. Select a category or create a new one by typing the name in so you can easily find your user segment in the future. Note the One-time/Daily toggle. In this case, we want the user segment to update with the most recent results (refreshed daily), so we will select Daily.
Examine and Extract for Cross-Selling
All of the prep work is done. You have set up a user segment of cat food purchasers and are ready to do your analysis.
Back to our question: Is this group purchasing cat toys?
Let’s build out our query.
-
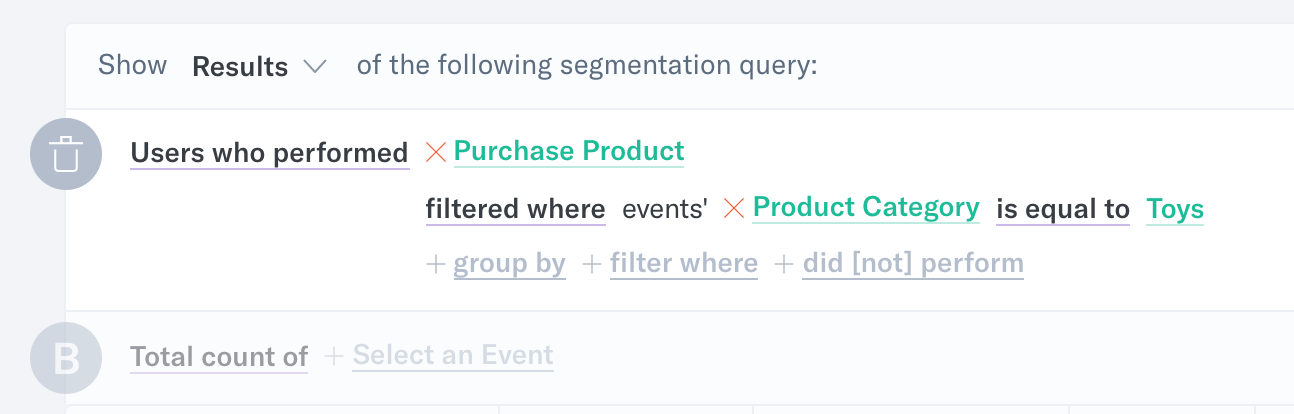
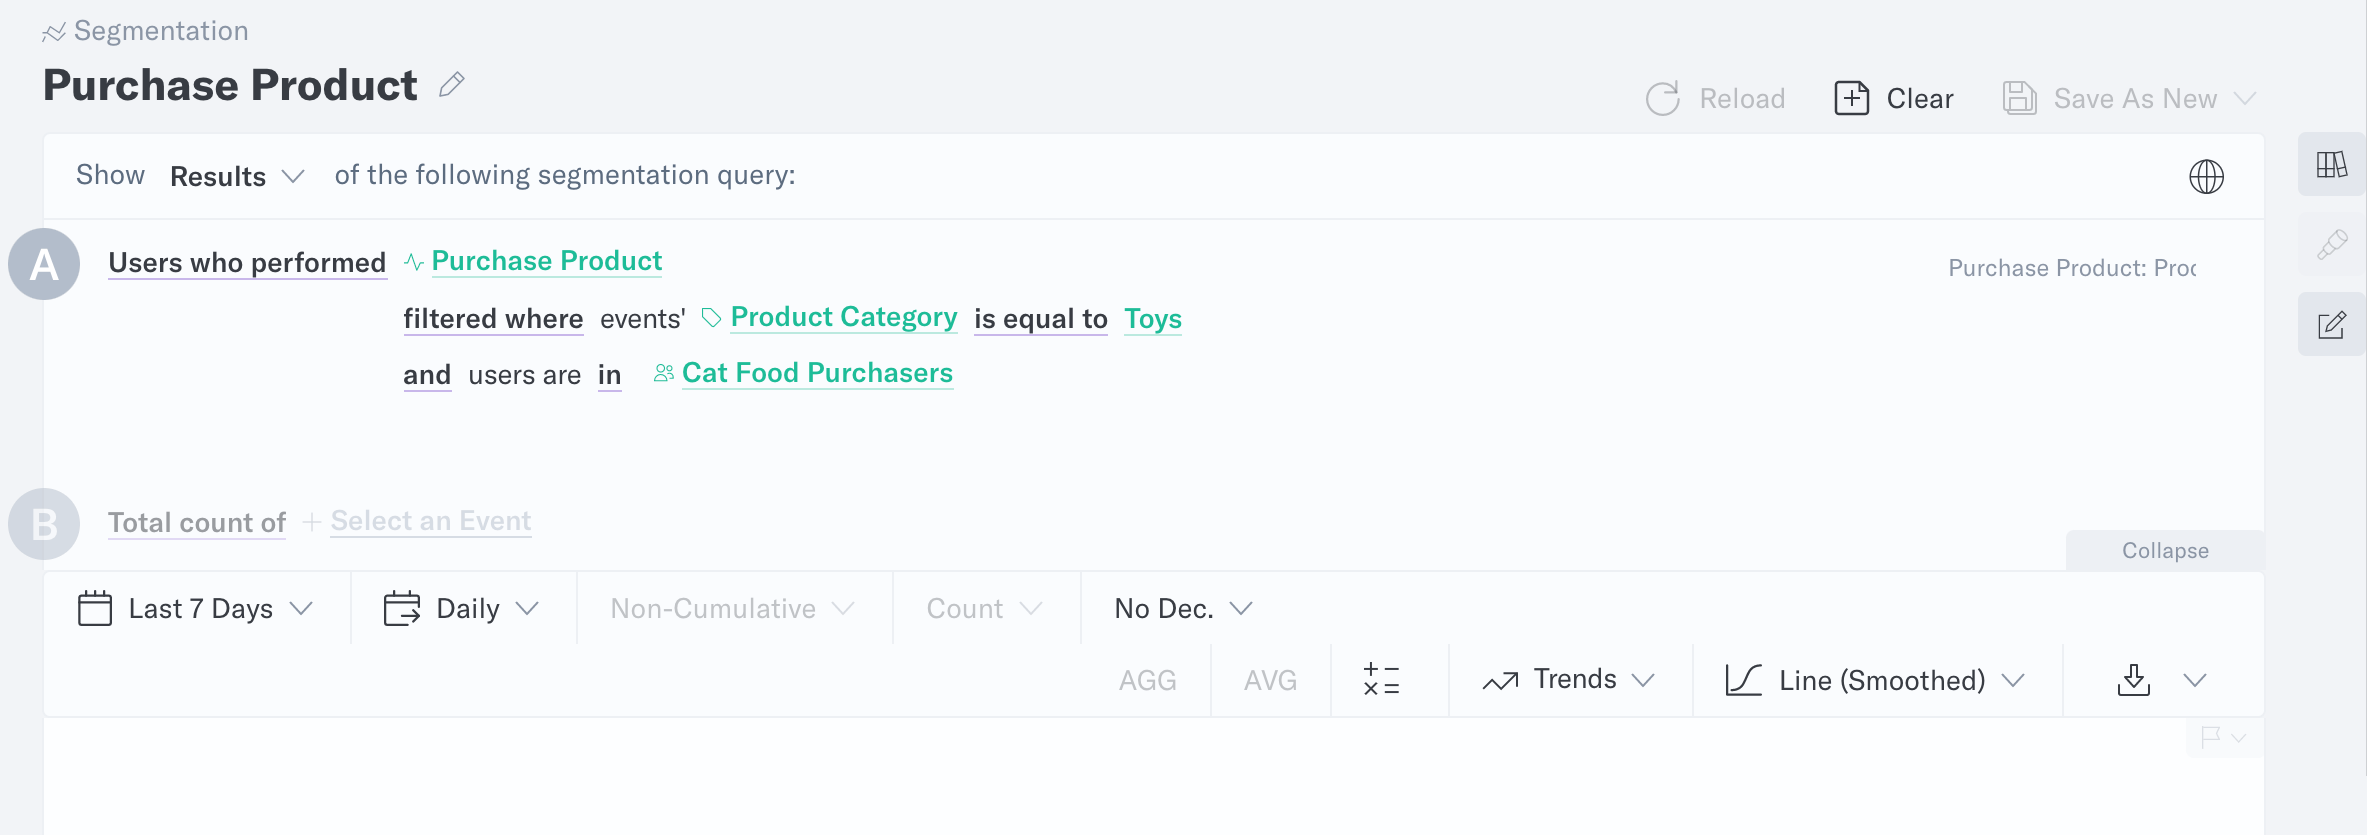
We want to see the number of Users who performed Purchase Product, using Filter Where Product Category is ”Toys” this time, instead of “Food”.
-
Remember, we want to see if cat food purchasers are buying cat toys so the only thing missing from this query are the cat food purchasers. Click on the new Filter Where selector and find your Cat Food Purchasers segment.
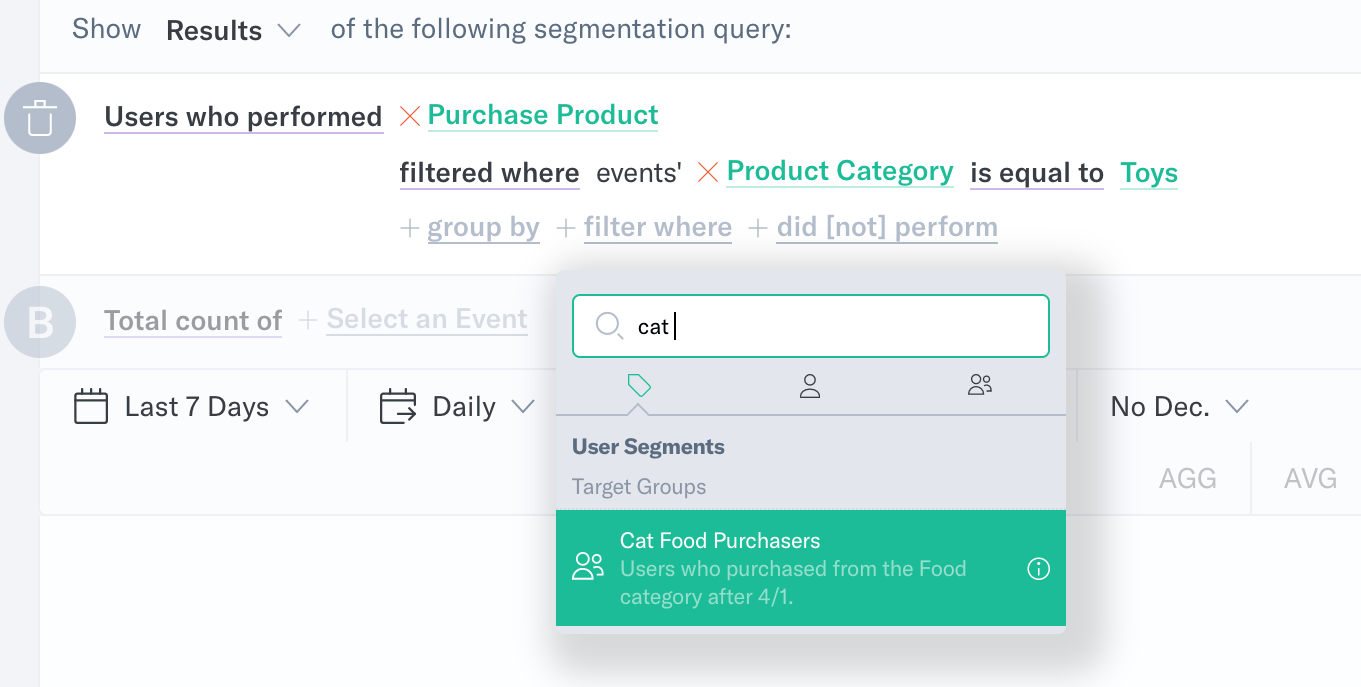
-
Now run the query and let’s take a look at the results.
Observation
We see “not enough data for visualization” which means there is no data available for this query. It looks like Cat Food Purchasers did not purchase cat toys at all since April. At this point, you can analyze further by changing the date range to see if these users purchased any cat toys in the past or start a marketing campaign to target these users for cross-selling.
Export your users to send a targeted campaign
You can export your users to engage with them outside of Analytics in one of two ways:
-
Download a CSV and upload it to your marketing tools.
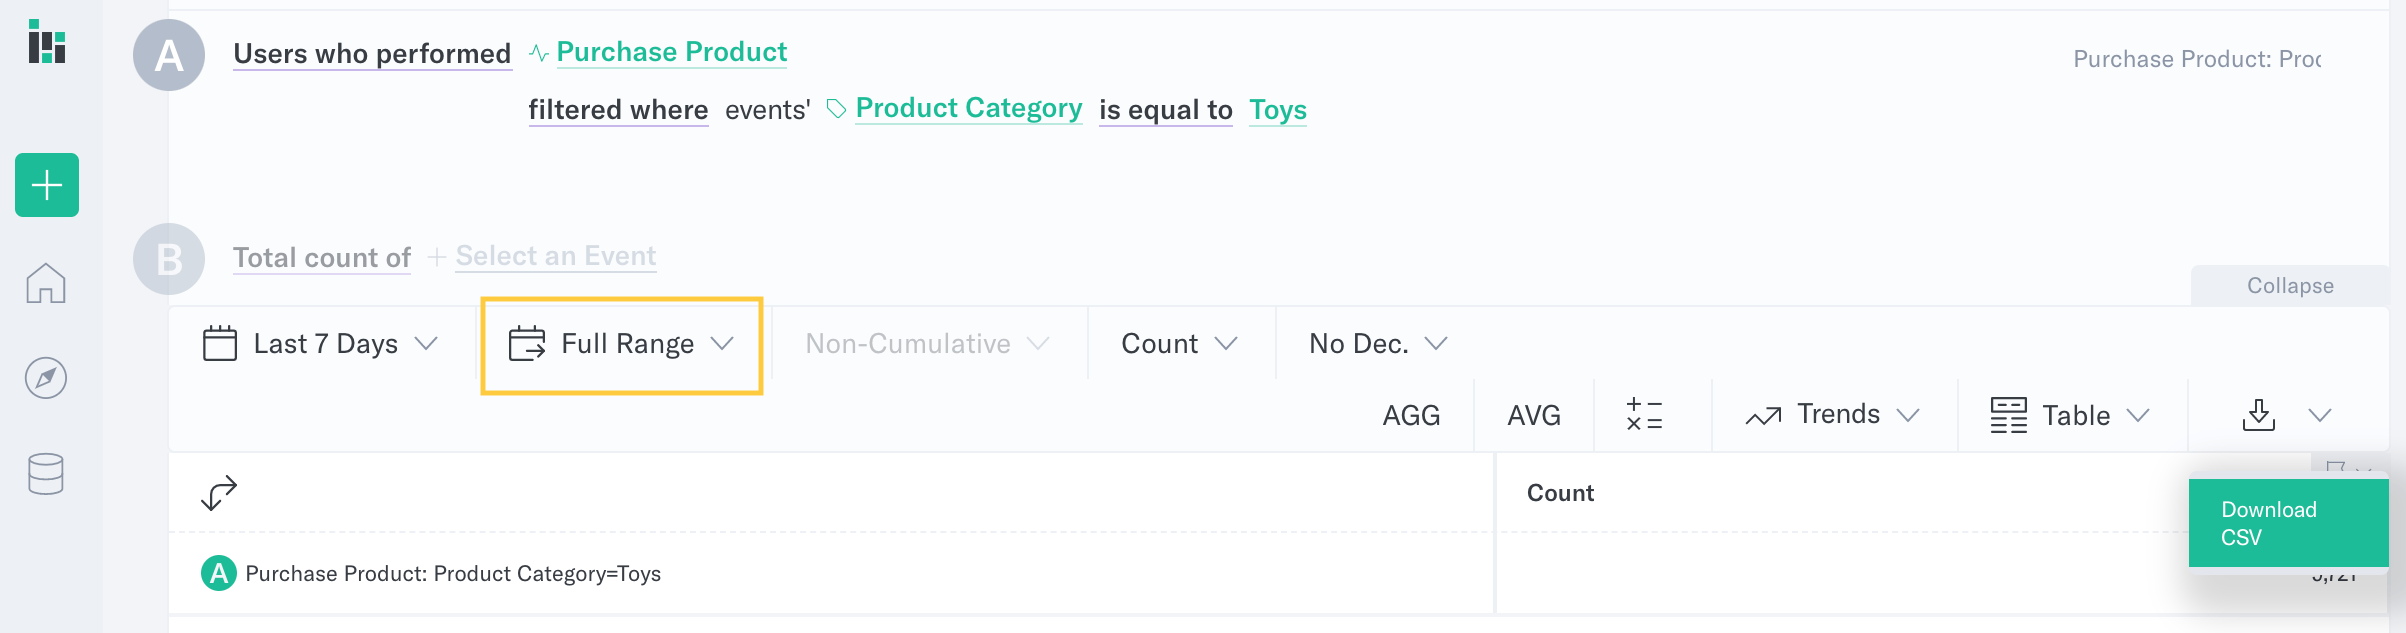
- Connect to our Segments API (available for Pro and Enterprise users) to make API calls to your automation tools.
We hope this tutorial gives you ideas on how you can use Analytics to analyze your data and achieve actionable insights from it. If you have any questions or comments, please reach out to support@mparticle.com.
Was this page helpful?
- Last Updated: March 12, 2025