Developers
API References
Data Subject Request API
Data Subject Request API Version 1 and 2
Data Subject Request API Version 3
Platform API
Key Management
Platform API Overview
Accounts
Apps
Audiences
Calculated Attributes
Data Points
Feeds
Field Transformations
Services
Users
Workspaces
Warehouse Sync API
Warehouse Sync API Overview
Warehouse Sync API Tutorial
Warehouse Sync API Reference
Data Mapping
Warehouse Sync SQL Reference
Warehouse Sync Troubleshooting Guide
ComposeID
Warehouse Sync API v2 Migration
Audit Logs API
Bulk Profile Deletion API Reference
Calculated Attributes Seeding API
Data Planning API
Custom Access Roles API
Group Identity API Reference
Pixel Service
Profile API
Events API
mParticle JSON Schema Reference
IDSync
Client SDKs
AMP
AMP SDK
Android
Initialization
Configuration
Network Security Configuration
Event Tracking
User Attributes
IDSync
Screen Events
Commerce Events
Location Tracking
Media
Kits
Application State and Session Management
Data Privacy Controls
Error Tracking
Opt Out
Push Notifications
WebView Integration
Logger
Preventing Blocked HTTP Traffic with CNAME
Workspace Switching
Linting Data Plans
Troubleshooting the Android SDK
API Reference
Upgrade to Version 5
Cordova
Cordova Plugin
Identity
Direct Url Routing
Direct URL Routing FAQ
Web
Android
iOS
iOS
Workspace Switching
Initialization
Configuration
Event Tracking
User Attributes
IDSync
Screen Tracking
Commerce Events
Location Tracking
Media
Kits
Application State and Session Management
Data Privacy Controls
Error Tracking
Opt Out
Push Notifications
Webview Integration
Upload Frequency
Preventing Blocked HTTP Traffic with CNAME
Linting Data Plans
Troubleshooting iOS SDK
Social Networks
iOS 14 Guide
iOS 15 FAQ
iOS 16 FAQ
iOS 17 FAQ
iOS 18 FAQ
API Reference
Upgrade to Version 7
Upgrade to Version 9
React Native
Getting Started
Identity
Unity
Upload Frequency
Getting Started
Opt Out
Initialize the SDK
Event Tracking
Commerce Tracking
Error Tracking
Screen Tracking
Identity
Location Tracking
Session Management
Web
Initialization
Configuration
Content Security Policy
Event Tracking
User Attributes
IDSync
Page View Tracking
Commerce Events
Location Tracking
Media
Kits
Application State and Session Management
Data Privacy Controls
Error Tracking
Opt Out
Custom Logger
Persistence
Native Web Views
Self-Hosting
Multiple Instances
Web SDK via Google Tag Manager
Preventing Blocked HTTP Traffic with CNAME
Facebook Instant Articles
Troubleshooting the Web SDK
Browser Compatibility
Linting Data Plans
API Reference
Upgrade to Version 2 of the SDK
Xamarin
Getting Started
Identity
Alexa
Quickstart
Android
Overview
Step 1. Create an input
Step 2. Verify your input
Step 3. Set up your output
Step 4. Create a connection
Step 5. Verify your connection
Step 6. Track events
Step 7. Track user data
Step 8. Create a data plan
Step 9. Test your local app
iOS Quick Start
Overview
Step 1. Create an input
Step 2. Verify your input
Step 3. Set up your output
Step 4. Create a connection
Step 5. Verify your connection
Step 6. Track events
Step 7. Track user data
Step 8. Create a data plan
Python Quick Start
Step 1. Create an input
Step 2. Create an output
Step 3. Verify output
Server SDKs
Node SDK
Go SDK
Python SDK
Ruby SDK
Java SDK
Guides
Partners
Introduction
Outbound Integrations
Outbound Integrations
Firehose Java SDK
Inbound Integrations
Compose ID
Data Hosting Locations
Glossary
Migrate from Segment to mParticle
Migrate from Segment to mParticle
Migrate from Segment to Client-side mParticle
Migrate from Segment to Server-side mParticle
Segment-to-mParticle Migration Reference
Rules Developer Guide
API Credential Management
The Developer's Guided Journey to mParticle
Guides
Composable Audiences
Composable Audiences Overview
User Guide
User Guide Overview
Warehouse Setup
Warehouse Setup Overview
Audience Setup
Frequently Asked Questions
Customer 360
Overview
User Profiles
Overview
User Profiles
Household Reach
Group Identity
Overview
Create and Manage Group Definitions
Calculated Attributes
Calculated Attributes Overview
Using Calculated Attributes
Create with AI Assistance
Calculated Attributes Reference
Predictions
Predictions Overview
What's Changed in the New Predictions UI
View and Manage Predictions
Predict Future Behavior
Future Behavior Predictions Overview
Create Future Behavior Prediction
Manage Future Behavior Predictions
Create an Audience with Future Behavior Predictions
Identity
Identity Dashboard
Identity Logs
Getting Started
Create an Input
Start capturing data
Connect an Event Output
Create an Audience
Connect an Audience Output
Transform and Enhance Your Data
Platform Guide
Billing
Usage and Billing Report
The New mParticle Experience
The new mParticle Experience
The Overview Map
Observability
Observability Overview
Observability User Guide
Observability Troubleshooting Examples
Observability Span Glossary
Platform Settings
Audit Logs
Key Management
Platform Configuration
Event Forwarding
Event Match Quality Dashboard
Notifications
System Alerts
Trends
Introduction
Data Retention
Data Catalog
Connections
Activity
Data Plans
Live Stream
Filters
Rules
Blocked Data Backfill Guide
Tiered Events
mParticle Users and Roles
Analytics Free Trial
Troubleshooting mParticle
Usage metering for value-based pricing (VBP)
IDSync
IDSync Overview
Use Cases for IDSync
Components of IDSync
Store and Organize User Data
Identify Users
Default IDSync Configuration
Profile Conversion Strategy
Profile Link Strategy
Profile Isolation Strategy
Best Match Strategy
Aliasing
Segmentation
Audiences
Audiences Overview
Create an Audience
Connect an Audience
Manage Audiences
Audience Sharing
Audience Expansion (Early Access)
Match Boost
FAQ
Inclusive & Exclusive Audiences (Early Access)
Inclusive & Exclusive Audiences Overview
Using Logic Blocks in Audiences
Combining Inclusive and Exclusive Audiences
Inclusive & Exclusive Audiences FAQ
Classic Audiences
Standard Audiences (Legacy)
Predictive Audiences
Predictive Audiences Overview
Using Predictive Audiences
New vs. Classic Experience Comparison
Analytics
Introduction
Core Analytics (Beta)
Setup
Sync and Activate Analytics User Segments in mParticle
User Segment Activation
Welcome Page Announcements
Settings
Project Settings
Roles and Teammates
Organization Settings
Global Project Filters
Portfolio Analytics
Analytics Data Manager
Analytics Data Manager Overview
Events
Event Properties
User Properties
Revenue Mapping
Export Data
UTM Guide
Analyses
Analyses Introduction
Segmentation: Basics
Getting Started
Visualization Options
For Clauses
Date Range and Time Settings
Calculator
Numerical Settings
Segmentation: Advanced
Assisted Analysis
Properties Explorer
Frequency in Segmentation
Trends in Segmentation
Did [not] Perform Clauses
Cumulative vs. Non-Cumulative Analysis in Segmentation
Total Count of vs. Users Who Performed
Save Your Segmentation Analysis
Export Results in Segmentation
Explore Users from Segmentation
Funnels: Basics
Getting Started with Funnels
Group By Settings
Conversion Window
Tracking Properties
Date Range and Time Settings
Visualization Options
Interpreting a Funnel Analysis
Funnels: Advanced
Group By
Filters
Conversion over Time
Conversion Order
Trends
Funnel Direction
Multi-path Funnels
Analyze as Cohort from Funnel
Save a Funnel Analysis
Explore Users from a Funnel
Export Results from a Funnel
Saved Analyses
Manage Analyses in Dashboards
Query Builder
Data Dictionary
Query Builder Overview
Modify Filters With And/Or Clauses
Query-time Sampling
Query Notes
Filter Where Clauses
Event vs. User Properties
Group By Clauses
Annotations
Cross-tool Compatibility
Apply All for Filter Where Clauses
Date Range and Time Settings Overview
User Attributes at Event Time
Understanding the Screen View Event
User Aliasing
Dashboards
Dashboards––Getting Started
Manage Dashboards
Dashboard Filters
Organize Dashboards
Scheduled Reports
Favorites
Time and Interval Settings in Dashboards
Query Notes in Dashboards
Analytics Resources
The Demo Environment
Keyboard Shortcuts
User Segments
Data Privacy Controls
Data Subject Requests
Default Service Limits
Feeds
Cross-Account Audience Sharing
Import Data with CSV Files
Import Data with CSV Files
CSV File Reference
SFTP Credentials
Glossary
Video Index
Analytics (Deprecated)
Identity Providers
Single Sign-On (SSO)
Setup Examples
Introduction
Developer Docs
Introduction
Integrations
Introduction
Rudderstack
Google Tag Manager
Segment
Data Warehouses and Data Lakes
Advanced Data Warehouse Settings
AWS Kinesis (Snowplow)
AWS Redshift (Define Your Own Schema)
AWS S3 Integration (Define Your Own Schema)
AWS S3 (Snowplow Schema)
BigQuery (Snowplow Schema)
BigQuery Firebase Schema
BigQuery (Define Your Own Schema)
GCP BigQuery Export
Snowflake (Snowplow Schema)
Snowplow Schema Overview
Snowflake (Define Your Own Schema)
Developer Basics
Aliasing
Integrations
24i
Event
Aarki
Audience
ABTasty
Audience
Actable
Feed
AdChemix
Event
AdMedia
Audience
Adobe Marketing Cloud
Cookie Sync
Platform SDK Events
Server-to-Server Events
Adobe Audience Manager
Audience
Adobe Experience Platform
Event
Adobe Campaign Manager
Audience
Adobe Target
Audience
AdPredictive
Feed
AgilOne
Event
Algolia
Event
Amazon Advertising
Audience
Amazon Kinesis
Event
Amazon Redshift
Data Warehouse
Amazon SNS
Event
Amazon SQS
Event
Amobee
Audience
Anodot
Event
Antavo
Feed
Apptentive
Event
Apptimize
Event
Apteligent
Event
Microsoft Azure Blob Storage
Event
Bing Ads
Event
Bluecore
Event
Bidease
Audience
Bluedot
Feed
Branch S2S Event
Event
Awin
Event
Bugsnag
Event
Cadent
Audience
comScore
Event
Census
Feed
Conversant
Event
Crossing Minds
Event
Custom Feed
Custom Feed
Didomi
Event
Datadog
Event
Databricks
Data Warehouse
Eagle Eye
Audience
Edge226
Audience
Emarsys
Audience
Epsilon
Event
Everflow
Audience
Facebook Offline Conversions
Event
Google Analytics for Firebase
Event
Flurry
Event
ForeSee
Event
Flybits
Event
FreeWheel Data Suite
Audience
Friendbuy
Event
Google Ad Manager
Audience
Google Analytics
Event
Google Analytics 4
Event
Google BigQuery
Audience
Data Warehouse
Google Enhanced Conversions
Event
Google Marketing Platform
Audience
Event
Cookie Sync
Google Marketing Platform Offline Conversions
Event
Google Pub/Sub
Event
Google Tag Manager
Event
Heap
Event
Hightouch
Feed
Herow
Feed
Hyperlocology
Event
Impact
Event
Ibotta
Event
ID5
Kit
InMarket
Audience
Inspectlet
Event
Intercom
Event
ironSource
Audience
Kafka
Event
Kissmetrics
Event
Kubit
Event
LaunchDarkly
Feed
LifeStreet
Audience
LiveLike
Event
Liveramp
Audience
Localytics
Event
mAdme Technologies
Event
MadHive
Audience
Marigold
Audience
MediaMath
Audience
Mediasmart
Audience
Microsoft Ads
Microsoft Ads Audience Integration
Microsoft Azure Event Hubs
Event
Mintegral
Audience
Monetate
Event
Movable Ink - V2
Event
Movable Ink
Event
Multiplied
Event
Nami ML
Feed
Nanigans
Event
NCR Aloha
Event
OneTrust
Event
Neura
Event
Oracle BlueKai
Event
Paytronix
Feed
Persona.ly
Audience
Personify XP
Event
Plarin
Event
Primer
Event
Qualtrics
Event
Quantcast
Event
Rakuten
Event
Reveal Mobile
Event
RevenueCat
Feed
Salesforce Mobile Push
Event
Scalarr
Event
SFTP
Audience
Shopify
Custom Pixel
Feed
SimpleReach
Event
Skyhook
Event
Singular-DEPRECATED
Event
Smadex
Audience
Slack
Event
SmarterHQ
Event
Snapchat Conversions
Event
Snowflake
Audience
Data Warehouse
Snowplow
Event
Splunk MINT
Event
StartApp
Audience
Talon.One
Audience
Feed
Event
Loyalty Feed
Tapad
Audience
Tapjoy
Audience
Taplytics
Event
Taptica
Audience
Teak
Audience
The Trade Desk
Audience
Event
Cookie Sync
Ticketure
Feed
Triton Digital
Audience
TUNE
Event
Valid
Event
Vkontakte
Audience
Vungle
Audience
Webtrends
Event
Webhook
Event
White Label Loyalty
Event
Wootric
Event
Xandr
Audience
Cookie Sync
Yotpo
Feed
Yahoo (formerly Verizon Media)
Audience
Cookie Sync
YouAppi
Audience
Regal
Event
Getting Started with Cohorts
The Cohort tool allows you to understand how often your customers return and engage with your website or product.
- Analyze drivers of user retention as well as the factors related to churn
- Create user cohorts based on repeated behaviors and attributes
- Identify customers with high lifetime value (LTV)
Build your Cohort Analysis
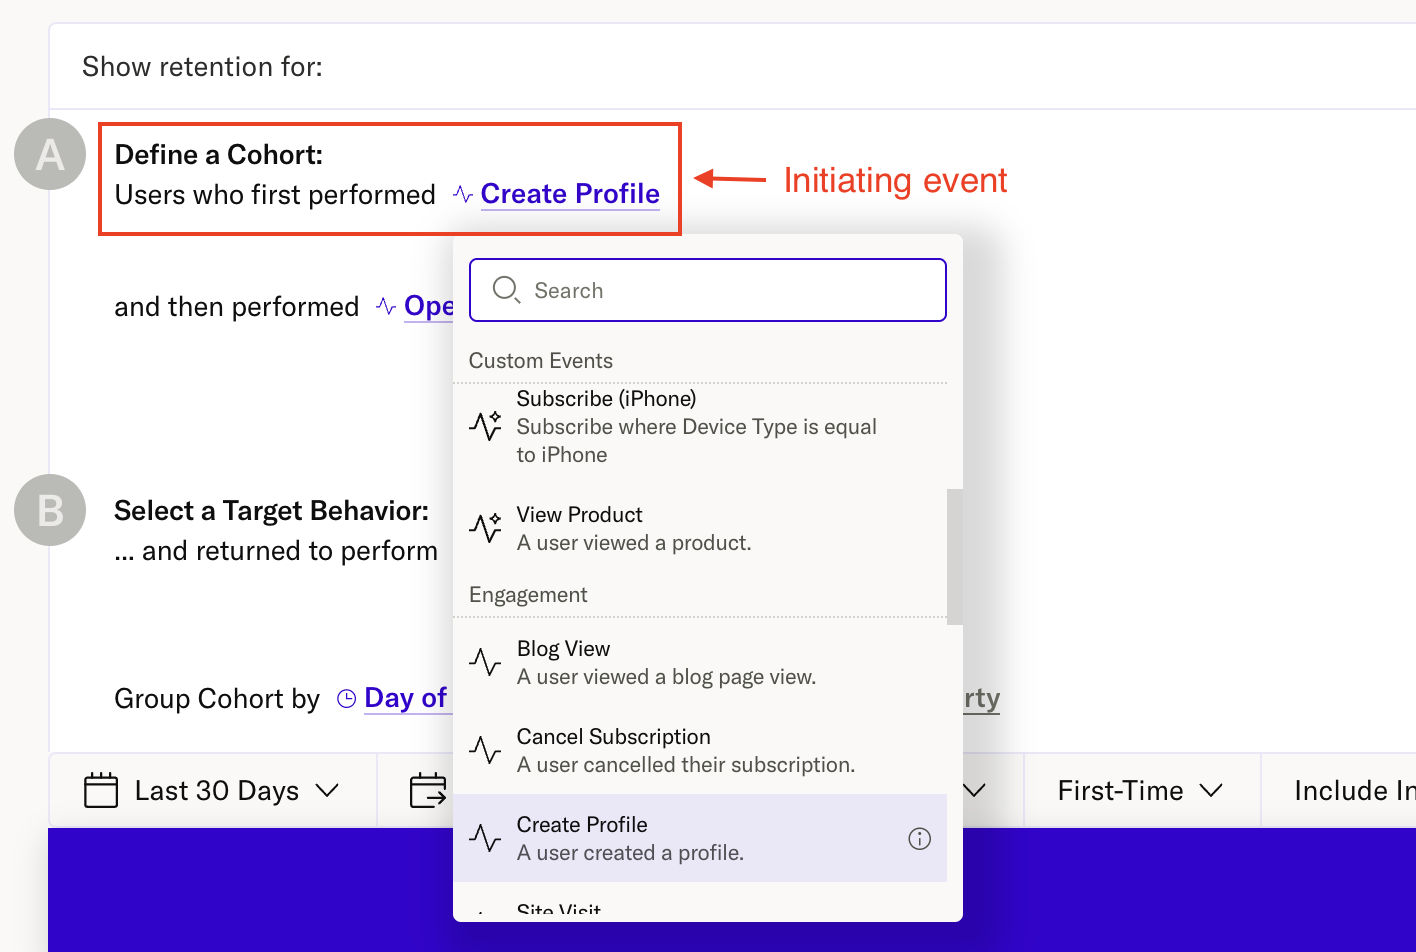
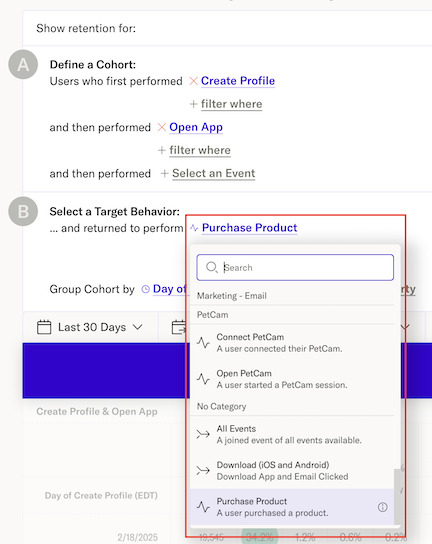
Define your Cohort
To begin a cohort query, determine an initiating event (called the Cohort event). The first event of a cohort is required; a user must complete the initiating event or Cohort event and then return to perform a second event which is explained in the section “Target Behavior”. Custom Events and Merged Events can be used. As with other tools, you may apply a Filter Where.
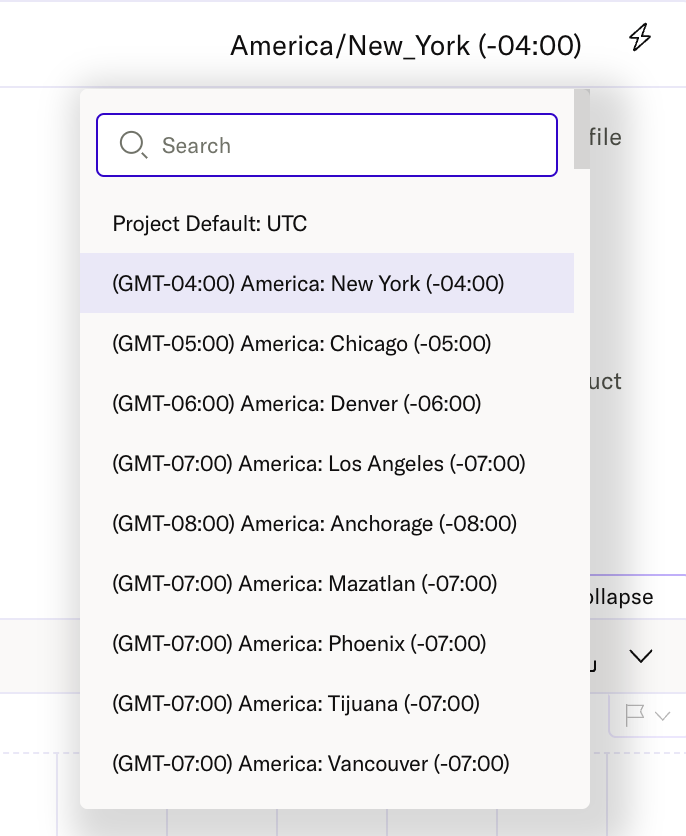
You may select a different time zone from your project time zone on a per query basis by locating the globe icon on the top right of the query screen.
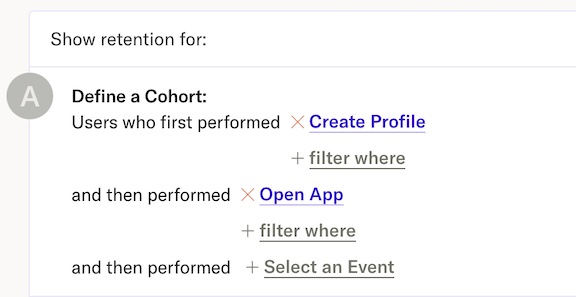
You can chain multiple events in a sequence using an “and then performed” clause to define your cohort of users.
Generations and Breakouts
In addition to the first event, cohorts can be defined by a shared generation or a shared property. A generation is a unit of time, such as a month. A monthly cohort would include all users who entered the cohort during that month. A property is a characteristic or attribute, such as device type. Cohorts defined by device type would include all users with an iPhone, all users with an Android, etc. A user will only appear once in the results of a cohort analysis. For generation cohorts, users will be put into the property breakout in which they first appear during the time interval.
Target Behavior
After selecting an initiating event, you must select a Target Behavior event. This second event of a cohort is also required; Custom Events and Merged Events can be used. As with the initiating event, you are also able to apply a Filter Where.
- Event: Often this is an event that is repeated multiple times, such as a purchase. This is the event that represents the subsequent user behavior that you wish to analyze.
- Revenue: Target behavior can also be represented as revenue. Using revenue as the target behavior will analyze the revenue generated over time by each cohort.
Customize Your Cohort Settings
Once you have defined your cohort, you can continue to add precision to your analysis with the following settings:
Date and Time Range Settings
Every query requires you to select a date range. In Cohort analysis, the date range refers to the time period during which a user completes all steps of the cohort query, defined in Row A. All new queries default to Last 30 Days. To open the date range selector dropdown, click on Last 30 Days. The start date is the first day to be included in the search. The end date is the last day. As mentioned in Cohort Basics, you can set the time zone for your Cohort query.
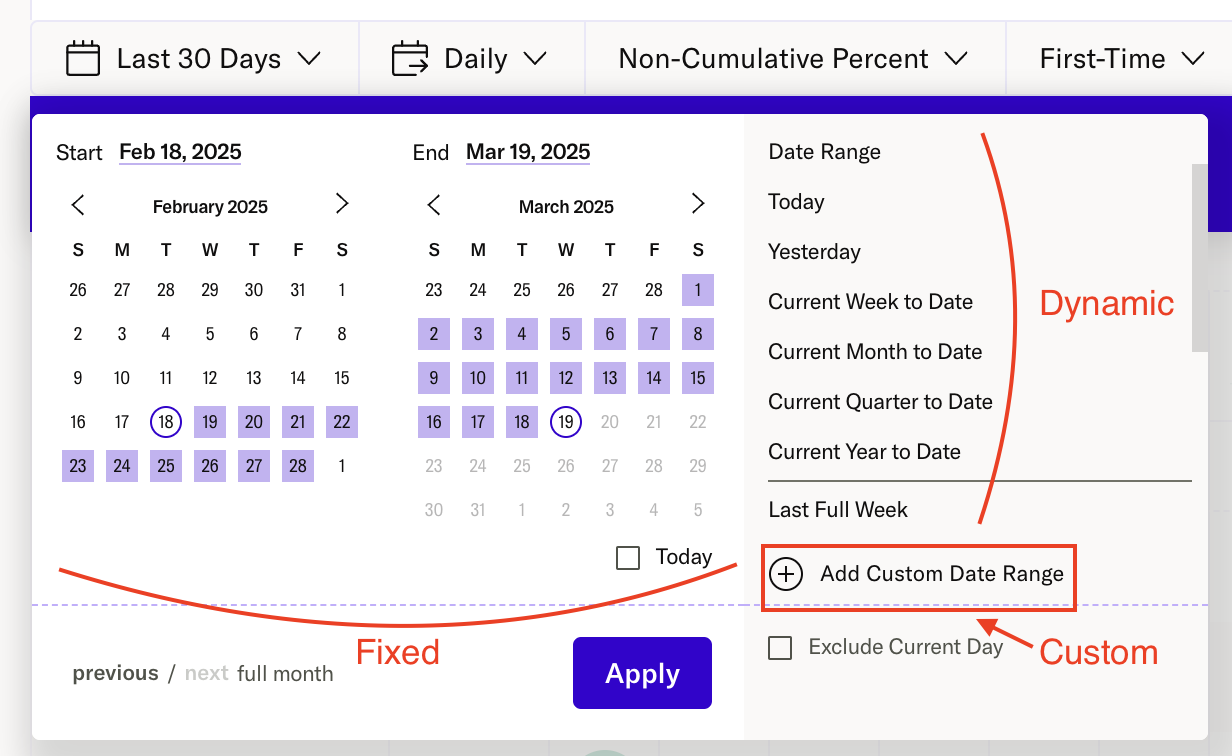
Fixed start and end dates Use the date range selector on the left side of the dropdown to select a start date and end date from the calendar. You can also enter a specific date by selecting on the date at the top of the selector and entering a value. Use the left and right arrows to navigate the calendar. Tick the Today checkbox to create a dynamic end date.
Dynamic date ranges The right side of the dropdown lists all of the dynamic date ranges that are available. You may choose a dynamic date range, for example Last 7 Days or Last Full Month. This will automatically update the date range of your query each time you view it, counting backwards from today. If you select Last Full Week, then Analytics will analyze the most recent complete week, defined as Monday to Sunday. If you select Last Full Month, then Analytics will analyze the most recent complete month. You can quickly navigate the calendar to select full months using the links in the lower left corner of the dropdown.
Custom ranges To save a custom date range, for example Last 45 Days, simply click Add Custom Date Range in the lower right corner of the dropdown. Your previously used custom date ranges will be saved for future use and are viewable alongside the default dynamic date ranges.
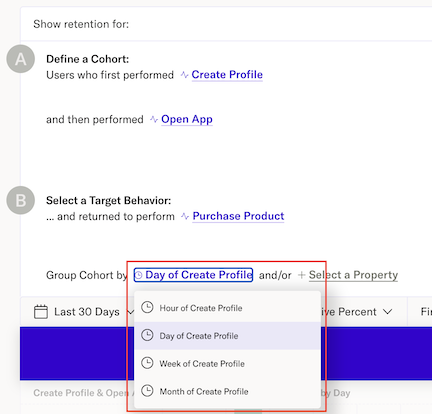
Generation
The generation setting in cohort analyses determines how users are grouped based on when they first performed a specified event. It defines the cohort’s starting point and can be set to an hourly, daily, weekly, or monthly interval. For example, if you create monthly cohorts based on newsletter signups, users will be grouped by their signup month (e.g., January signups, February signups, etc.).
Hourly
- Groups users based on the hour they first performed the event.
- Example: Users who made their first purchase at 10 AM are in a different cohort from those who purchased at 11 AM.
Daily
- Groups users based on the day they first performed the event.
- Example: Users who signed up for a trial on March 1 are in a different cohort from those who signed up on March 2.
Weekly
- Groups users based on the week they first performed the event.
- Example: Users who downloaded an app in the first week of March belong to a different cohort than those who downloaded it in the second week.
Monthly
- Groups users based on the month they first performed the event.
- Example: Users who subscribed to a newsletter in January are in a different cohort from those who subscribed in February.
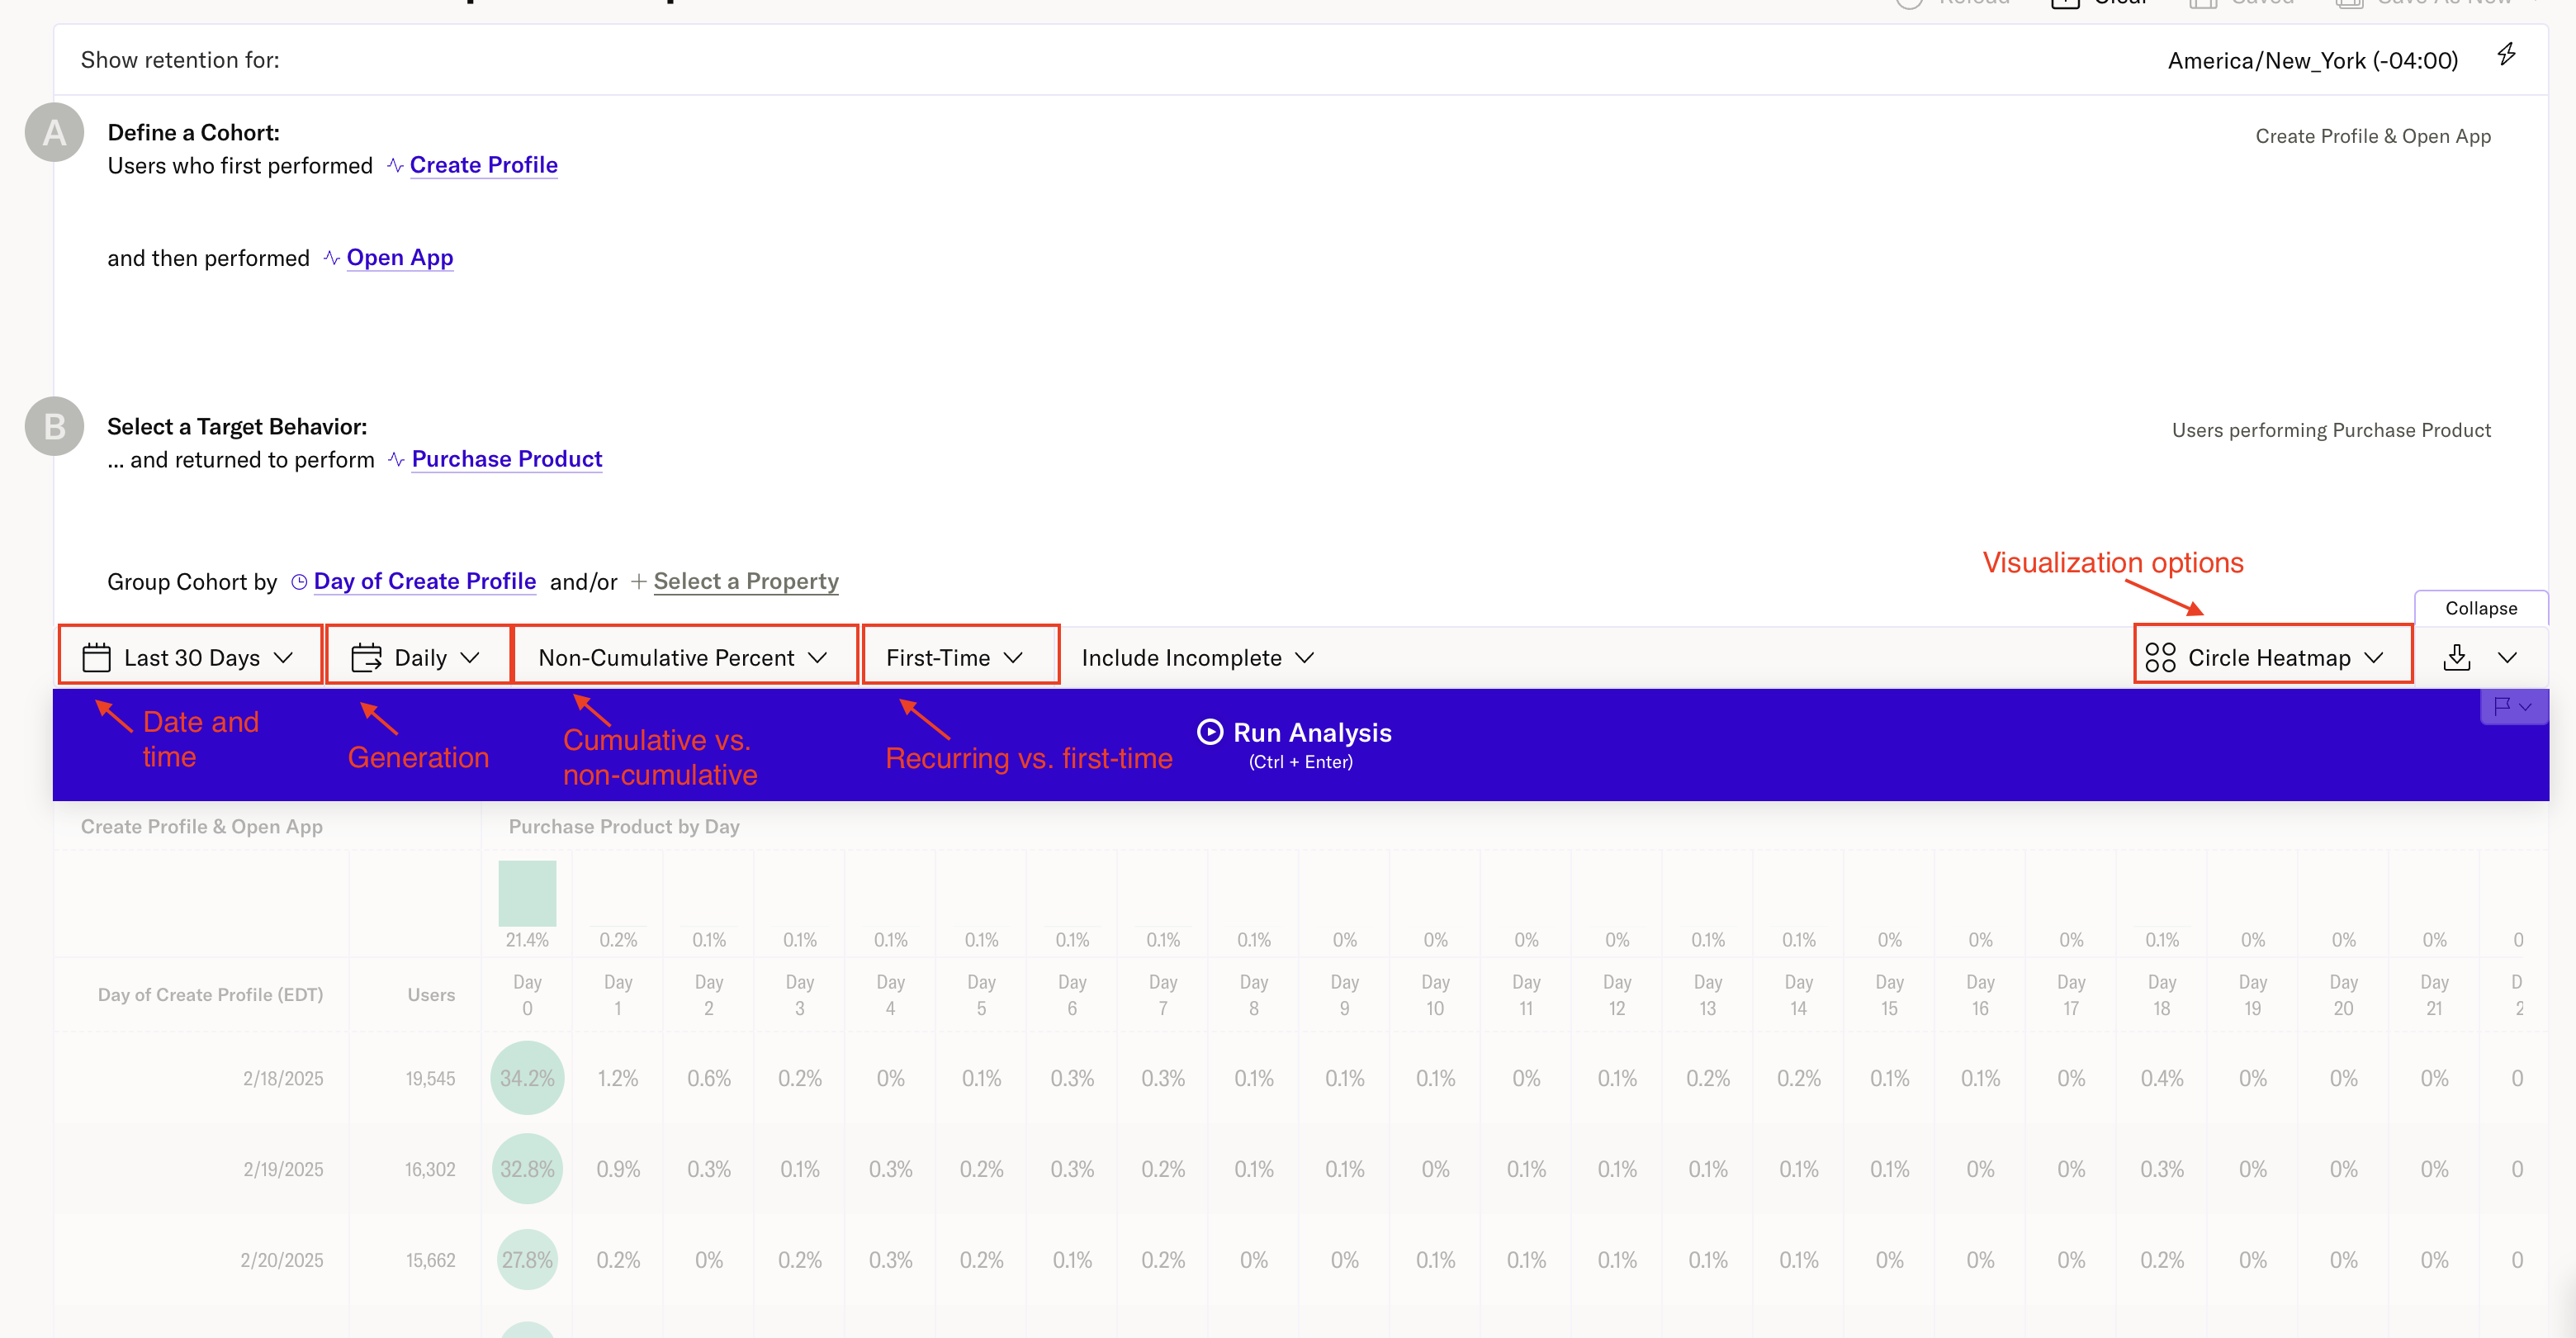
Recurring vs. First-Time
Cohort queries can track either recurring target behavior or the first occurrence of a behavior after the initial event.
- Recurring: A user appears multiple times if they repeat the target behavior.
- First-Time: A user appears only once, indicating when they first completed the target behavior.
Example:
A box subscription company tracks purchases after a “Newsletter Sign Up” event.
- Recurring Query: If User A signed up in January and purchased in March, April, and May, they appear in the January cohort and in the Month 3, 4, and 5 columns.
- First-Time Query: User A appears only in the Month 3 column for their first purchase.
First-time queries enforce exclusivity per interval, while recurring queries allow users to appear in multiple intervals.
Cumulative vs. Non-Cumulative
By default, cohort queries use the Non-Cumulative setting.
- Non-Cumulative: Shows the count or percentage of users who completed the target behavior within each interval.
- Cumulative: Displays a running total of users who completed the target behavior over time (only available for first-time behavior).
For more details, see Cumulative vs. Non-Cumulative Analysis in Cohort.
Available Metrics:
- Non-Cumulative Percent: Percentage of users who completed the target behavior in each time interval or breakout.
- Non-Cumulative Count: Number of users who completed the target behavior at each interval.
- Cumulative Percent: Running percentage of users completing the target behavior for the first time.
- Cumulative Count: Running total of users completing the target behavior for the first time.
Visualization Options
Cohort analyses have four different visualization options: Circle Heatmap, Heatmap, Line Chart and Area Chart. You can toggle between these options in the visualization dropdowns. You can also download a cohort analysis as a CSV file.
Annotations
Cohort annotations act as general notes about the cohort analysis over the entire designated date range. To add an annotation to Cohort, click on the Annotation flag icon in the query builder window and click Add an Annotation. To access existing annotations, click the Annotation icon in the Data Panel. For more information about annotations, visit this article.
Was this page helpful?
- Last Updated: May 26, 2026