Developers
API References
Data Subject Request API
Data Subject Request API Version 1 and 2
Data Subject Request API Version 3
Platform API
Key Management
Platform API Overview
Accounts
Apps
Audiences
Calculated Attributes
Data Points
Feeds
Field Transformations
Services
Users
Workspaces
Warehouse Sync API
Warehouse Sync API Overview
Warehouse Sync API Tutorial
Warehouse Sync API Reference
Data Mapping
Warehouse Sync SQL Reference
Warehouse Sync Troubleshooting Guide
ComposeID
Warehouse Sync API v2 Migration
Audit Logs API
Bulk Profile Deletion API Reference
Calculated Attributes Seeding API
Data Planning API
Custom Access Roles API
Group Identity API Reference
Pixel Service
Profile API
Events API
mParticle JSON Schema Reference
IDSync
Client SDKs
AMP
AMP SDK
Android
Initialization
Configuration
Network Security Configuration
Event Tracking
User Attributes
IDSync
Screen Events
Commerce Events
Location Tracking
Media
Kits
Application State and Session Management
Data Privacy Controls
Error Tracking
Opt Out
Push Notifications
WebView Integration
Logger
Preventing Blocked HTTP Traffic with CNAME
Workspace Switching
Linting Data Plans
Troubleshooting the Android SDK
API Reference
Upgrade to Version 5
Cordova
Cordova Plugin
Identity
Direct Url Routing
Direct URL Routing FAQ
Web
Android
iOS
iOS
Workspace Switching
Initialization
Configuration
Event Tracking
User Attributes
IDSync
Screen Tracking
Commerce Events
Location Tracking
Media
Kits
Application State and Session Management
Data Privacy Controls
Error Tracking
Opt Out
Push Notifications
Webview Integration
Upload Frequency
App Extensions
Preventing Blocked HTTP Traffic with CNAME
Linting Data Plans
Troubleshooting iOS SDK
Social Networks
iOS 14 Guide
iOS 15 FAQ
iOS 16 FAQ
iOS 17 FAQ
iOS 18 FAQ
API Reference
Upgrade to Version 7
React Native
Getting Started
Identity
Unity
Upload Frequency
Getting Started
Opt Out
Initialize the SDK
Event Tracking
Commerce Tracking
Error Tracking
Screen Tracking
Identity
Location Tracking
Session Management
Web
Initialization
Configuration
Content Security Policy
Event Tracking
User Attributes
IDSync
Page View Tracking
Commerce Events
Location Tracking
Media
Kits
Application State and Session Management
Data Privacy Controls
Error Tracking
Opt Out
Custom Logger
Persistence
Native Web Views
Self-Hosting
Multiple Instances
Web SDK via Google Tag Manager
Preventing Blocked HTTP Traffic with CNAME
Facebook Instant Articles
Troubleshooting the Web SDK
Browser Compatibility
Linting Data Plans
API Reference
Upgrade to Version 2 of the SDK
Xamarin
Getting Started
Identity
Alexa
Quickstart
Android
Overview
Step 1. Create an input
Step 2. Verify your input
Step 3. Set up your output
Step 4. Create a connection
Step 5. Verify your connection
Step 6. Track events
Step 7. Track user data
Step 8. Create a data plan
Step 9. Test your local app
iOS Quick Start
Overview
Step 1. Create an input
Step 2. Verify your input
Step 3. Set up your output
Step 4. Create a connection
Step 5. Verify your connection
Step 6. Track events
Step 7. Track user data
Step 8. Create a data plan
Python Quick Start
Step 1. Create an input
Step 2. Create an output
Step 3. Verify output
Server SDKs
Node SDK
Go SDK
Python SDK
Ruby SDK
Java SDK
Guides
Partners
Introduction
Outbound Integrations
Outbound Integrations
Firehose Java SDK
Inbound Integrations
Compose ID
Data Hosting Locations
Glossary
Migrate from Segment to mParticle
Migrate from Segment to mParticle
Migrate from Segment to Client-side mParticle
Migrate from Segment to Server-side mParticle
Segment-to-mParticle Migration Reference
Rules Developer Guide
API Credential Management
The Developer's Guided Journey to mParticle
Guides
Composable Audiences
Composable Audiences Overview
User Guide
User Guide Overview
Warehouse Setup
Warehouse Setup Overview
Audience Setup
Frequently Asked Questions
Customer 360
Overview
User Profiles
Overview
User Profiles
Group Identity
Overview
Create and Manage Group Definitions
Calculated Attributes
Calculated Attributes Overview
Using Calculated Attributes
Create with AI Assistance
Calculated Attributes Reference
Predictions
Predictions Overview
What's Changed in the New Predictions UI
View and Manage Predictions
Predict Future Behavior
Future Behavior Predictions Overview
Create Future Behavior Prediction
Manage Future Behavior Predictions
Create an Audience with Future Behavior Predictions
Identity
Identity Dashboard
Identity Logs
Getting Started
Create an Input
Start capturing data
Connect an Event Output
Create an Audience
Connect an Audience Output
Transform and Enhance Your Data
Platform Guide
Billing
Usage and Billing Report
The New mParticle Experience
The new mParticle Experience
The Overview Map
Observability
Observability Overview
Observability User Guide
Observability Troubleshooting Examples
Observability Span Glossary
Platform Settings
Key Management
Audit Logs
Platform Configuration
Event Forwarding
Event Match Quality Dashboard
Notifications
System Alerts
Trends
Introduction
Data Retention
Data Catalog
Connections
Activity
Data Plans
Live Stream
Filters
Rules
Blocked Data Backfill Guide
Tiered Events
mParticle Users and Roles
Analytics Free Trial
Troubleshooting mParticle
Usage metering for value-based pricing (VBP)
IDSync
IDSync Overview
Use Cases for IDSync
Components of IDSync
Store and Organize User Data
Identify Users
Default IDSync Configuration
Profile Conversion Strategy
Profile Link Strategy
Profile Isolation Strategy
Best Match Strategy
Aliasing
Segmentation
Audiences
Audiences Overview
Create an Audience
Connect an Audience
Manage Audiences
Audience Sharing
Audience Expansion (Early Access)
Match Boost
FAQ
Inclusive & Exclusive Audiences (Early Access)
Inclusive & Exclusive Audiences Overview
Using Logic Blocks in Audiences
Combining Inclusive and Exclusive Audiences
Inclusive & Exclusive Audiences FAQ
Classic Audiences
Standard Audiences (Legacy)
Predictive Audiences
Predictive Audiences Overview
Using Predictive Audiences
New vs. Classic Experience Comparison
Analytics
Introduction
Core Analytics (Beta)
Setup
Sync and Activate Analytics User Segments in mParticle
User Segment Activation
Welcome Page Announcements
Settings
Project Settings
Roles and Teammates
Organization Settings
Global Project Filters
Portfolio Analytics
Analytics Data Manager
Analytics Data Manager Overview
Events
Event Properties
User Properties
Revenue Mapping
Export Data
UTM Guide
Analyses
Analyses Introduction
Segmentation: Basics
Getting Started
Visualization Options
For Clauses
Date Range and Time Settings
Calculator
Numerical Settings
Segmentation: Advanced
Assisted Analysis
Properties Explorer
Frequency in Segmentation
Trends in Segmentation
Did [not] Perform Clauses
Cumulative vs. Non-Cumulative Analysis in Segmentation
Total Count of vs. Users Who Performed
Save Your Segmentation Analysis
Export Results in Segmentation
Explore Users from Segmentation
Funnels: Basics
Getting Started with Funnels
Group By Settings
Conversion Window
Tracking Properties
Date Range and Time Settings
Visualization Options
Interpreting a Funnel Analysis
Funnels: Advanced
Group By
Filters
Conversion over Time
Conversion Order
Trends
Funnel Direction
Multi-path Funnels
Analyze as Cohort from Funnel
Save a Funnel Analysis
Export Results from a Funnel
Explore Users from a Funnel
Saved Analyses
Manage Analyses in Dashboards
Query Builder
Data Dictionary
Query Builder Overview
Modify Filters With And/Or Clauses
Query-time Sampling
Query Notes
Filter Where Clauses
Event vs. User Properties
Group By Clauses
Annotations
Cross-tool Compatibility
Apply All for Filter Where Clauses
Date Range and Time Settings Overview
User Attributes at Event Time
Understanding the Screen View Event
User Aliasing
Dashboards
Dashboards––Getting Started
Manage Dashboards
Dashboard Filters
Organize Dashboards
Scheduled Reports
Favorites
Time and Interval Settings in Dashboards
Query Notes in Dashboards
Analytics Resources
The Demo Environment
Keyboard Shortcuts
User Segments
Data Privacy Controls
Data Subject Requests
Default Service Limits
Feeds
Cross-Account Audience Sharing
Import Data with CSV Files
Import Data with CSV Files
CSV File Reference
Glossary
Video Index
Analytics (Deprecated)
Identity Providers
Single Sign-On (SSO)
Setup Examples
Introduction
Developer Docs
Introduction
Integrations
Introduction
Rudderstack
Google Tag Manager
Segment
Data Warehouses and Data Lakes
Advanced Data Warehouse Settings
AWS Kinesis (Snowplow)
AWS Redshift (Define Your Own Schema)
AWS S3 Integration (Define Your Own Schema)
AWS S3 (Snowplow Schema)
BigQuery (Snowplow Schema)
BigQuery Firebase Schema
BigQuery (Define Your Own Schema)
GCP BigQuery Export
Snowflake (Snowplow Schema)
Snowplow Schema Overview
Snowflake (Define Your Own Schema)
Developer Basics
Aliasing
Integrations
24i
Event
Aarki
Audience
ABTasty
Audience
Actable
Feed
AdChemix
Event
AdMedia
Audience
Adobe Marketing Cloud
Cookie Sync
Platform SDK Events
Server-to-Server Events
Adobe Audience Manager
Audience
Adobe Experience Platform
Event
Adobe Campaign Manager
Audience
Adobe Target
Audience
AdPredictive
Feed
AgilOne
Event
Algolia
Event
Amazon Advertising
Audience
Amazon Kinesis
Event
Amazon S3
Event
Amazon Redshift
Data Warehouse
Amazon SNS
Event
Amazon SQS
Event
Amobee
Audience
Anodot
Event
Antavo
Feed
Apptentive
Event
Awin
Event
Apptimize
Event
Apteligent
Event
Microsoft Azure Blob Storage
Event
Bidease
Audience
Bing Ads
Event
Bluecore
Event
Bluedot
Feed
Branch S2S Event
Event
Bugsnag
Event
Cadent
Audience
Census
Feed
comScore
Event
Conversant
Event
Crossing Minds
Event
Custom Feed
Custom Feed
Databricks
Data Warehouse
Didomi
Event
Datadog
Event
Eagle Eye
Audience
Edge226
Audience
Emarsys
Audience
Epsilon
Event
Everflow
Audience
Facebook Offline Conversions
Event
Google Analytics for Firebase
Event
Flurry
Event
Flybits
Event
ForeSee
Event
FreeWheel Data Suite
Audience
Friendbuy
Event
Google Ad Manager
Audience
Google Analytics
Event
Google BigQuery
Audience
Data Warehouse
Google Analytics 4
Event
Google Enhanced Conversions
Event
Google Marketing Platform
Audience
Cookie Sync
Event
Google Marketing Platform Offline Conversions
Event
Google Pub/Sub
Event
Google Tag Manager
Event
Heap
Event
Herow
Feed
Hightouch
Feed
Hyperlocology
Event
Ibotta
Event
ID5
Kit
Impact
Event
Inspectlet
Event
Intercom
Event
InMarket
Audience
Kafka
Event
ironSource
Audience
Kissmetrics
Event
Kubit
Event
LaunchDarkly
Feed
LifeStreet
Audience
LiveLike
Event
Liveramp
Audience
Localytics
Event
MadHive
Audience
mAdme Technologies
Event
Marigold
Audience
MediaMath
Audience
Microsoft Ads
Microsoft Ads Audience Integration
Mediasmart
Audience
Microsoft Azure Event Hubs
Event
Mintegral
Audience
Monetate
Event
Movable Ink
Event
Movable Ink - V2
Event
Multiplied
Event
Nami ML
Feed
Nanigans
Event
NCR Aloha
Event
Neura
Event
OneTrust
Event
Oracle BlueKai
Event
Paytronix
Feed
Persona.ly
Audience
Personify XP
Event
Plarin
Event
Primer
Event
Qualtrics
Event
Quantcast
Event
Rakuten
Event
Reveal Mobile
Event
RevenueCat
Feed
Salesforce Mobile Push
Event
Scalarr
Event
Shopify
Feed
Custom Pixel
SimpleReach
Event
Singular-DEPRECATED
Event
Skyhook
Event
Smadex
Audience
Slack
Event
SmarterHQ
Event
Snapchat Conversions
Event
Snowflake
Audience
Data Warehouse
Snowplow
Event
Splunk MINT
Event
StartApp
Audience
Tapad
Audience
Talon.One
Audience
Event
Loyalty Feed
Feed
Tapjoy
Audience
Taplytics
Event
Taptica
Audience
Teak
Audience
Ticketure
Feed
The Trade Desk
Cookie Sync
Audience
Event
Triton Digital
Audience
TUNE
Event
Valid
Event
Vkontakte
Audience
Webhook
Event
Vungle
Audience
White Label Loyalty
Event
Webtrends
Event
Wootric
Event
Xandr
Audience
Cookie Sync
Yotpo
Feed
Yahoo (formerly Verizon Media)
Audience
Cookie Sync
YouAppi
Audience
Regal
Event
Interpreting a Funnel Analysis
Overview
Analytics Funnels provide best in class intelligence and insight on how users are completing key steps and where users are encountering friction and failing to achieve KPIs. At a high level, Funnels are much more than SQL or BI reports. Funnels contain complicated multi-step computations that can’t be reduced to simple SELECT-FROM-WHERE statements. The events in the funnel must occur in sequential order. And the order of events can either forward in time or backward, as explained in the Funnel Direction article. And report options are available that further refine results to align with the business logic of each step in the report. Funnels show overall completion rate and time to complete. And each step in the funnel has additional statistics and details available.
Metrics
Within Funnels, there are a number of important data points to take note of. Funnels are user-centric and reflect unique user counts and conversion percentages. Funnel metrics are constrained to both the Funnel Entry Date Range. when the user completed the first step of the funnel, and Conversion Limit selected. With simple report settings changes, you can explore how completion rates vary as these times are adjusted. For example, funnel completion rates should go up as the time range increases because users are given a longer window to complete the steps.
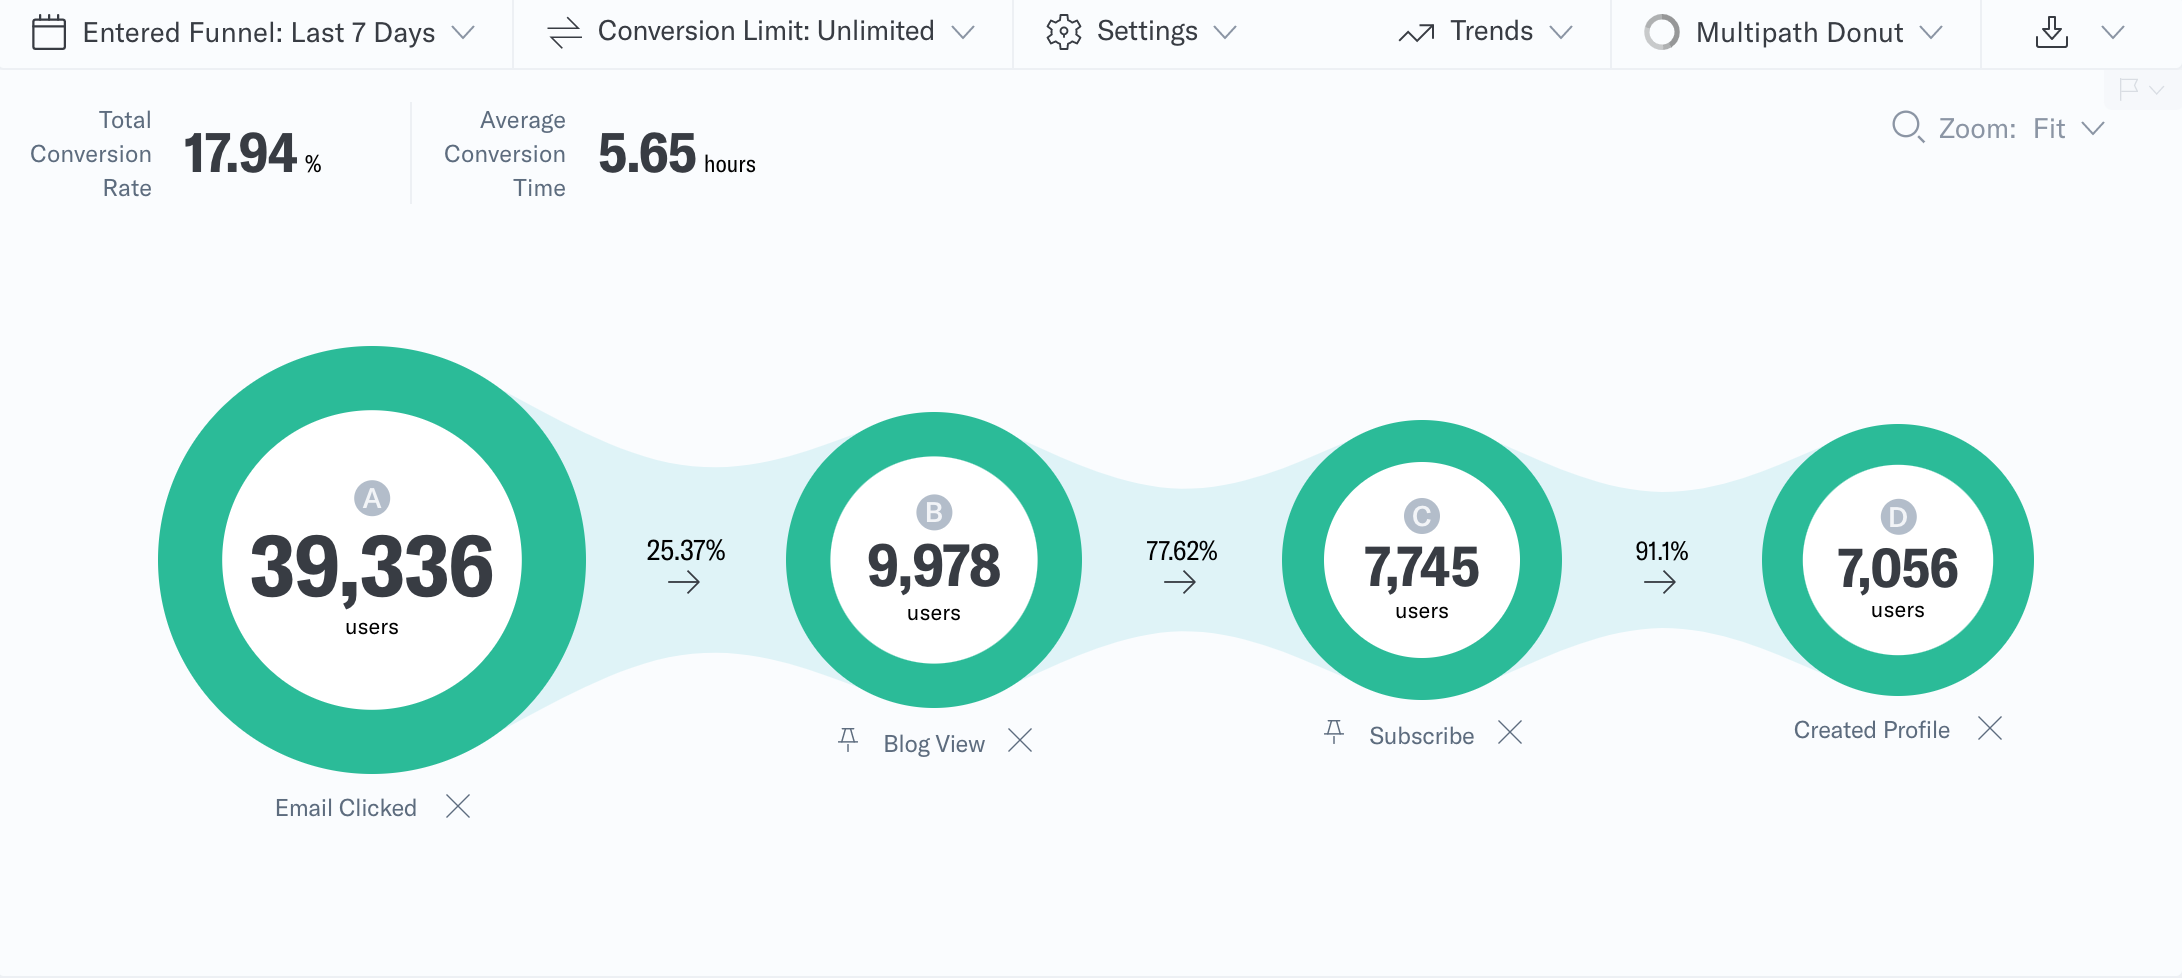
- Average Conversion Time is the average time it took users to get from the first step to the last.
- Total Conversion Rate is the percentage of users who successfully completed the entire funnel.
- Events are represented by blue circles, each containing the unique count of users who completed a particular event or series of events.
- Webbing is the area that connects each event in the funnel. Within the webbings, you can view the conversion rate between each step.
Path insights
Path Insights displays a variety of important funnel metrics. To access Path Insights, select an event in your funnel.
- Path displays which step users completed before completing the selected step.
- Total Drop displays the percentage of users lost in the progression from the previous step to the selected step.
- Total Conversion displays the percentage of users that made it from the previous step to the selected step.
- Average Step Time displays the average amount of time it took users to get from the previous step to the selected step.
Conversion precision
In the Conversion Precision article, you can see all the options to fine tune your results to match business use-cases. Key among these settings is the ability to allow some overlap in events by a few seconds. This feature is important in cases where events are collected around the same time. For example, a funnel tracking a front-end Registration Button Click event followed by a back-end Account Created event may need to allow a few second overlap in timestamp values to capture all new accounts. Funnels allow the overlap - along with precise control of the maximum number of seconds events could overlap and still be considered sequential.
In the Path Insights, you may choose a path to access the Data Insights Menu. From there, select “Open in Cohort” or “Open in User Insights” to view the funnel information in other contexts. These features give you the ability to download the users at a specific step for validation or re-targeting. See Cross-Tool Compatibility in Funnel for more information.
Zoom
You may zoom in and out of your funnel by using the dropdown menu in the top right corner of the chart window.
Funnel flexibility
Funnels typically follow the critical steps to complete a user journey. For example, a commerce app would have browse, cart and buy as steps. But Analytics Funnels support more complex business logic including optional steps. The only steps in Funnels that are required are the first step and the last step. All others can be flagged as optional. When users flow through the optional steps, there is path exclusivity. That means that a user can appear in only one path or if the user appears multiple times, it is once for each path that they completed. In the commerce example, this could be the product compare feature or a size chart. For more information, see the Multipath Funnel article.
Funnels allow you to test the importance of funnel steps by setting steps to inactive without completely deleting them. This is useful for understanding the impact of a step in overall conversion. And once your key funnel reports are in use, the trending option helps you monitor funnel performance over time.
When there are key user characteristics that significantly contribute to conversion patterns, funnels can be built to group together users by an additional attribute. User by age group or user by sign up channel are interesting ways to dig into how users interact with a digital property. Depending on the attribute selected, users may land in the funnel more than once. Consider a user who visits first from search and then shortly after from a social ad. The grouped funnel can handle the complexity of treating those visits separately to understand which inbound channel has a more positive impact on conversion.
Conclusion
Many tools have funnel and conversion reporting. Analytics Funnels take funnel reporting to the next level with controls and exploratory features. Funnels are simple to adjust even as they seamlessly turn on the complex computational logic needed to understand digital behavior.
Was this page helpful?
- Last Updated: March 31, 2026